Guest Contributor: What Does Diversification Cost?

By Joshua Ungerecht, managing partner at ExchangeRight
Roughly 10 to 30 basis points. That’s typically all it takes to provide considerable downside protection through strategic diversification.
Even if the net cash flow (after state tax filing costs) of a strategically diversified offering were slightly lower than market average, the cost would still be worth the reduction in risk achieved through diversification. But when the cost to diversify is calculated, as shown below, it is clear that strategically diversified offerings may provide after-tax cash flows as high or as higher than market average even after factoring in those costs.
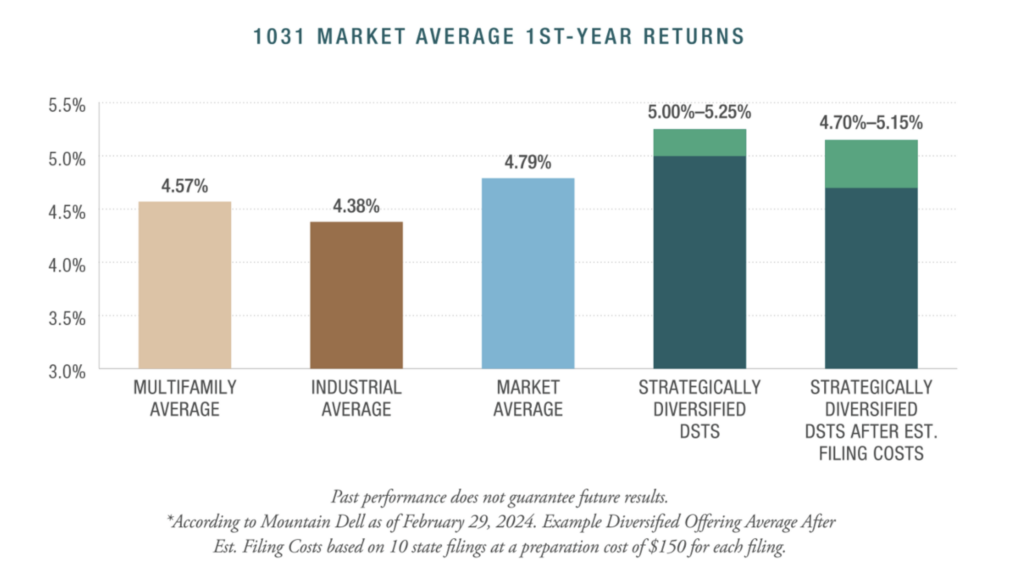
According to Mountain Dell Consulting, as of Feb. 29, 2024, the average year-one cash flow across all offerings in the 1031 Delaware statutory trust market is 4.79%. Strategically diversified offerings generating 5% to 5.25% in first-year cash flows would net approximately 4.7% to 5.15% cash flows to investors after factoring in the cost for their certified public accountant to handle all their state tax filings, potentially delivering after-tax cash flows at or above market average.
So, if a strategically diversified offering can achieve 5% pre-tax returns, then investors may be able to benefit from strategic diversification while still enjoying net cash flows higher than the average for single-asset and less diversified DSTs. Individual results will depend on the specific circumstances of each investor.
The Cost of Binary Risk
The cost of investing in an offering that is overconcentrated in any one property, location, market, tenant, industry or lease term, however, is harder to appreciate up front, more difficult to measure, and can be drastic. Diversification is especially important for investors in or near retirement, where strategic diversification may greatly reduce the impact of underperformance of any one property, market, tenant, or industry on their nest egg and the income on which they depend.
This lesson was made painfully clear in the Great Recession, where the difference between investors who got wiped out and those who made it through intact many times boiled down to their level of diversification. The more strategically diversified an investor was by property, geography, industry and tenant, the more likely it was that they would survive and eventually thrive on the other side of the economic cycle. With rare exception, those who had their exchanges overconcentrated in only one to three properties were far more likely to suffer losses of most or all of their income and capital.
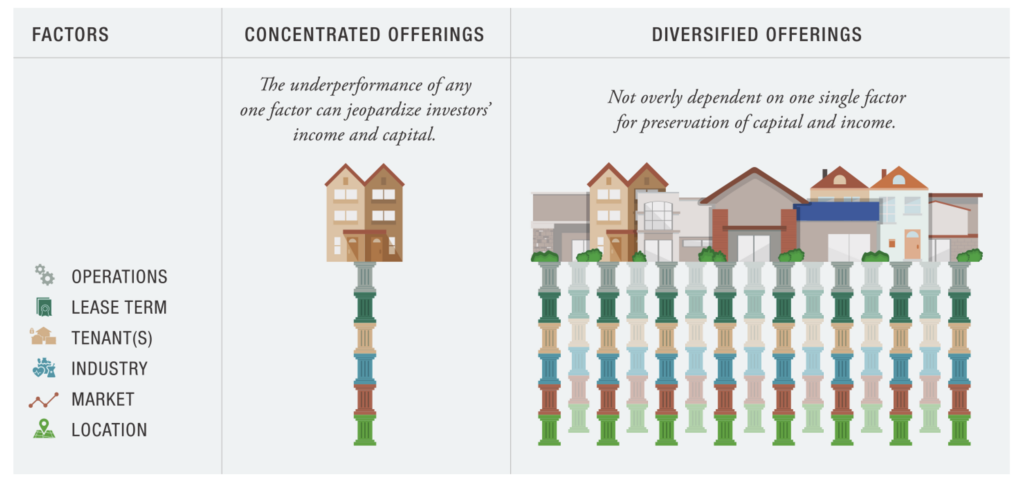 Investments lacking strategic diversification expose investors to binary risk, the risk of being overly dependent on any one factor that could underperform and cause the entire investment to underperform or fail. Multiple layers of binary risk occur when an investment is overconcentrated in a particular property, market, tenant or industry, so that its success depends on favorable outcomes at each and every one of those levels, in addition to favorable conditions in the macroeconomic market, real estate market, and debt markets throughout the hold period.
Put another way, overconcentration of an investor’s capital into any one investment requires the stars to align simply to protect the investor’s capital and deliver projected cash flow returns. A performance failure or significant headwind at any one layer of binary risk could disrupt an investor’s income and result in a material loss of their investment capital.
Calculating the Cost of Diversification
The net cost of strategic diversification boils down to the cost of filing multiple state tax returns. Let’s look at an example of a hypothetical diversified DST portfolio to demonstrate the net state filing cost delta for typical investors, who already reside or invest in states that require income tax:
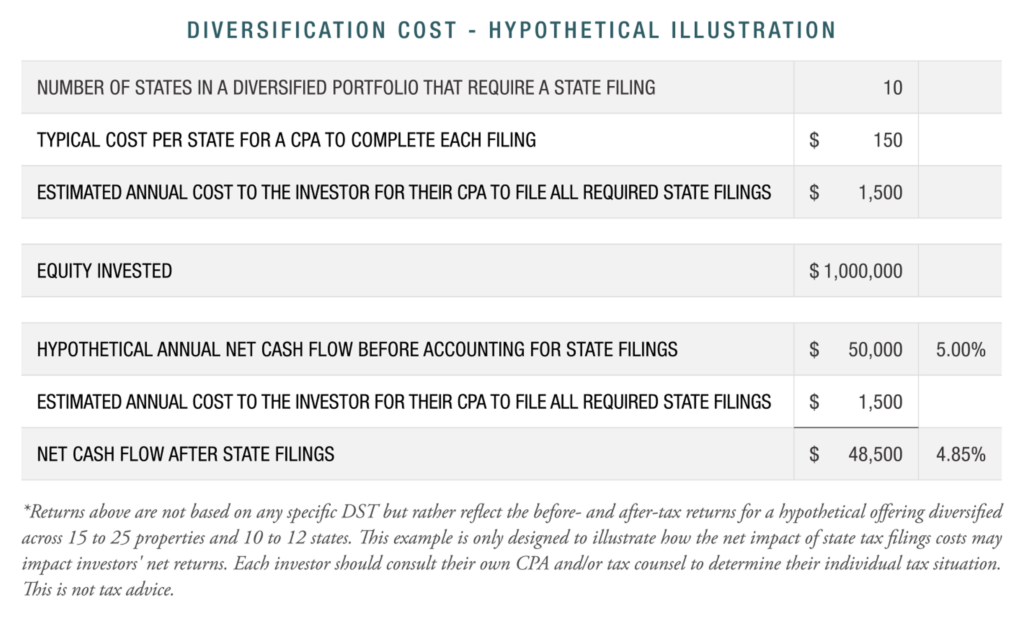 The illustration above assumes a $1,000,000 investment in a DST that is diversified across 15 to 25 properties, 10 to 12 states, and which requires state tax filings in 10 different states, leading to a tax-filing cost estimate of 15 basis points. Materially larger investments would of course drive the net percentage cost to cash flow even lower, whereas smaller investments would drive the net percentage cost proportionately higher.
For the typical DST investor, the actual cost of diversification is far less than the value of the downside protection secured through insulating performance from overdependence on one single factor, especially through times of economic uncertainty. And given the reality that some diversified DSTs provide net cash flows that are materially above the market average even after factoring in the cost of state filings that accompanies strategic diversification, investors interested in security aren’t required to sacrifice their distribution to avoid binary risk but may be able to achieve the best of both worlds.
This material is for educational purposes only. This information does not constitute tax advice. Please consult with your CPA or tax counsel prior to making any financial decisions.
Joshua Ungerecht currently serves as a managing partner of ExchangeRight. ExchangeRight and its affiliates’ vertically integrated platform features more than $5.9 billion in assets under management that are diversified across over 1,200 properties and 24 million square feet throughout 47 states.
The views and opinions expressed in the preceding article are those of the author and do not necessarily reflect the views of The DI Wire. Past performance does not guarantee future results.
For more ExchangeRight news, please visit their directory page.